Find your way around
Mycorr has two kinds of screen: the pages you reach from the sidebar, where you find and organize your work, and the canvas of a model, where you work on tables. This page names the parts of each, so the rest of the docs can point at them.
The sidebar
The sidebar runs down the left of every page. Fold it with the Mycorr logo when you want more room.
| Item | What it opens |
|---|---|
| Organization (the name at the top) | Switch organization, or open its settings with the gear that appears on hover |
| Notifications | Invitations, access requests, shares and other updates. A dot marks unread ones. |
| Spaces | The overview of your models, with the organization's spaces listed beneath it |
| Shared with me | Spaces and models shared with you from other organizations. Appears only when there are some. |
| Datasets | Curated sets of tables you can share and publish |
| Recipes | Saved, reusable queries |
| Apps | AI apps that design tables or research data for you |
| Connections | Your saved links to Google Sheets, databases, buckets and files |
| Trash | Deleted models and spaces, restorable for 30 days |
| Access | Personal access tokens and the steps to connect AI assistants |
| Support | A form that reaches the Mycorr team: a question, feedback, a bug or an enterprise enquiry |
| Your name (at the foot) | Account settings and Log Out |
Under Spaces, each space in the organization is listed. Hover over one for New space, which creates a space inside it, and Space settings.
The overview
Spaces opens the overview: everything you can reach in the current organization.
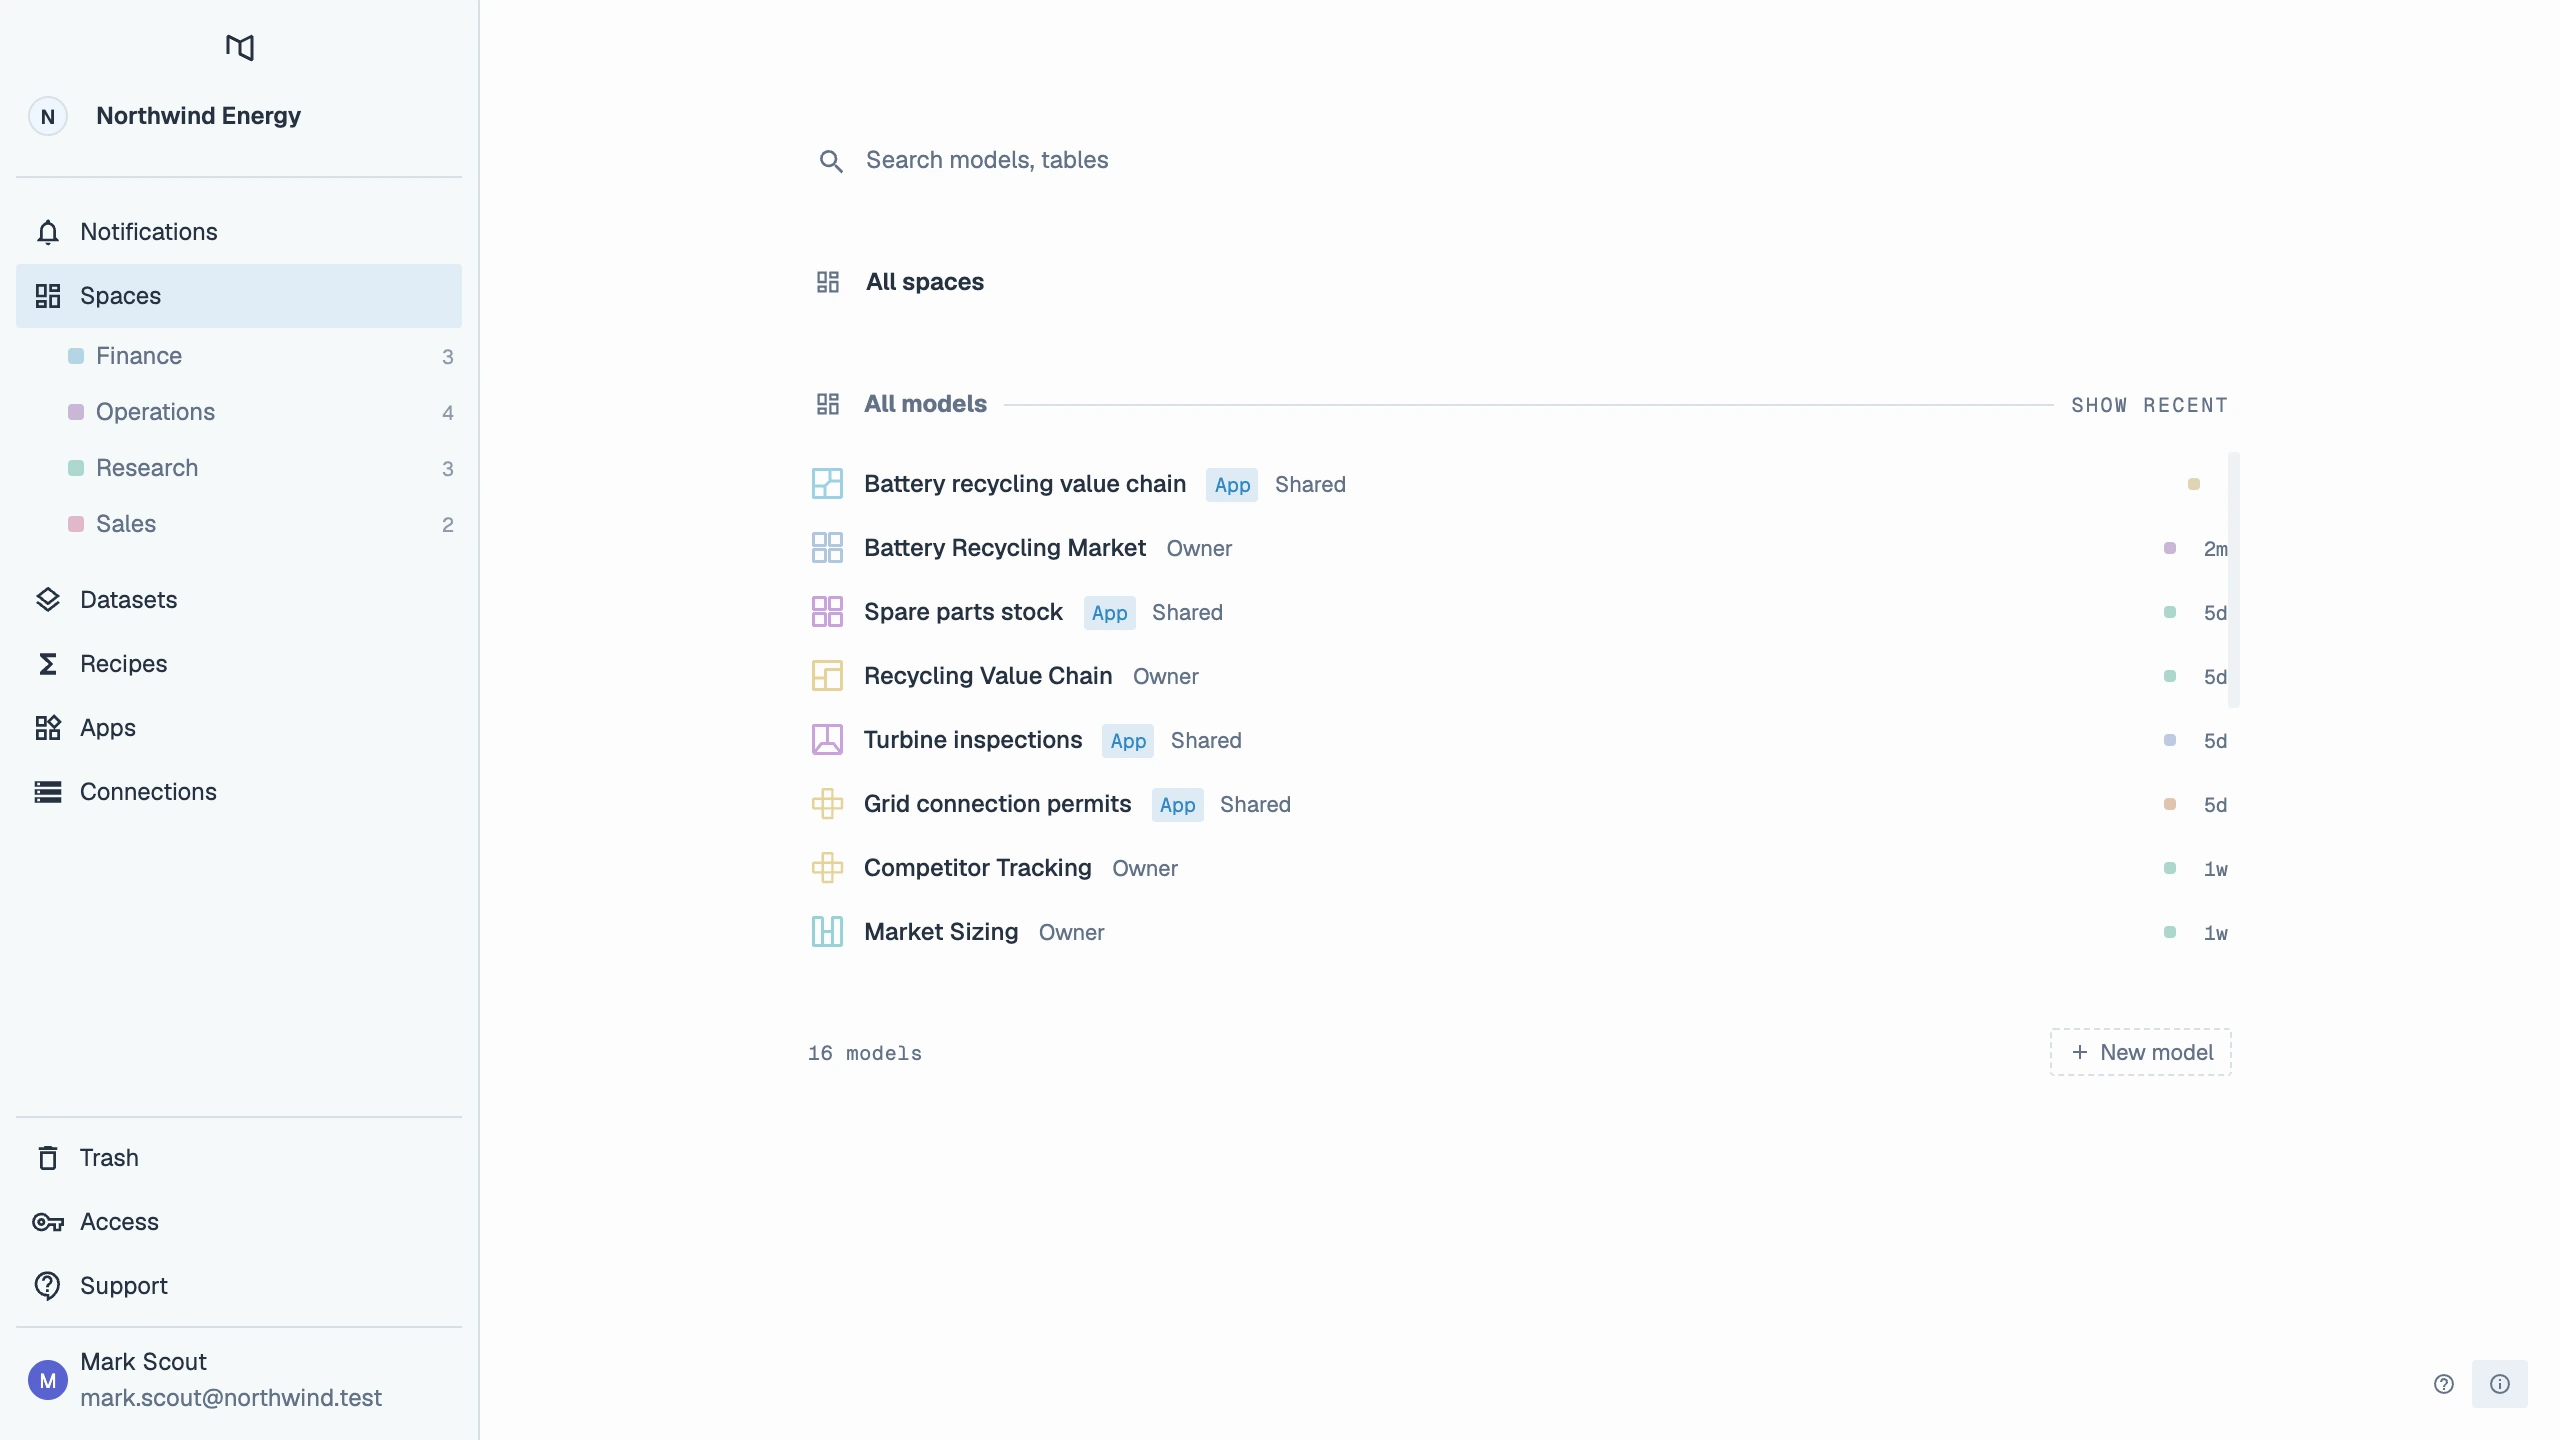
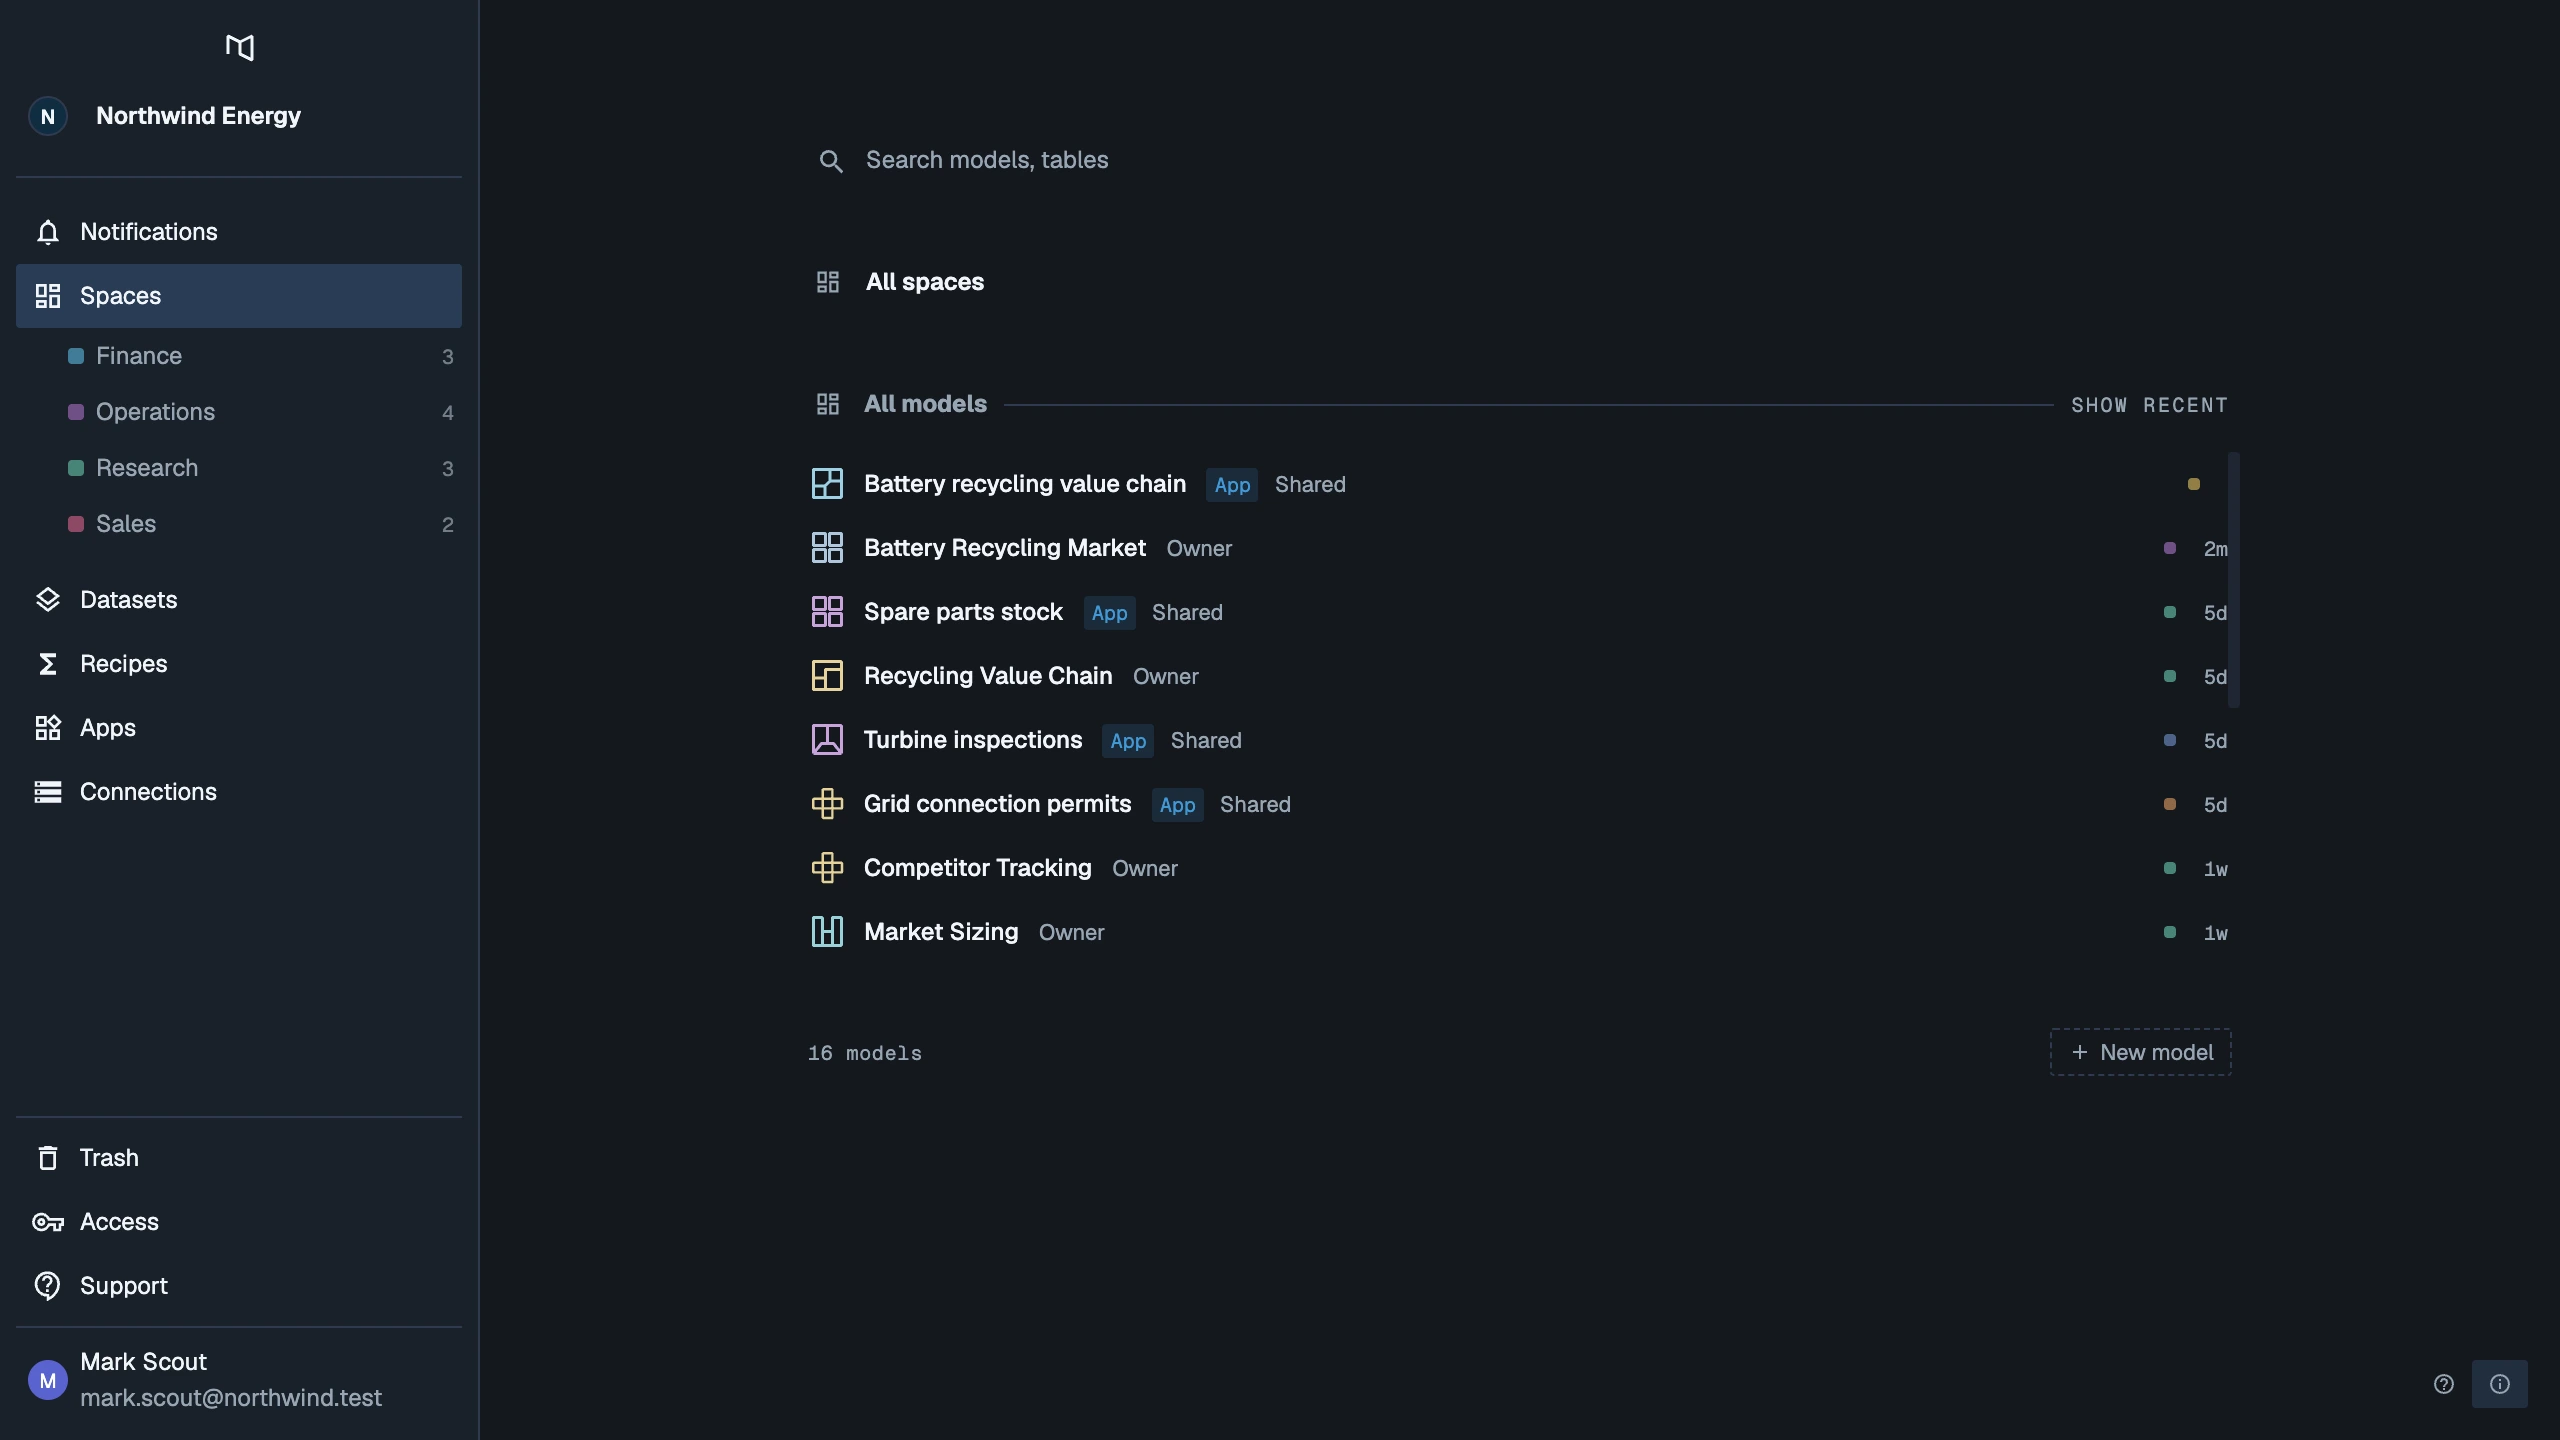
- Search finds models, tables and datasets by name across every space. Press ⌘ K (Ctrl K on Windows and Linux) to jump to it.
- Pinned keeps your most-used models at the top.
- The list shows Recent models by default; Show all lists every model, and a space filter narrows it to one space.
- New model creates a model in the space you choose.
- Each model row has a menu: Open, Pin, Rename, Change appearance, Manage access, Move to space, Copy model ID and Delete.
- Take a tour replays the Getting started tour.
The canvas
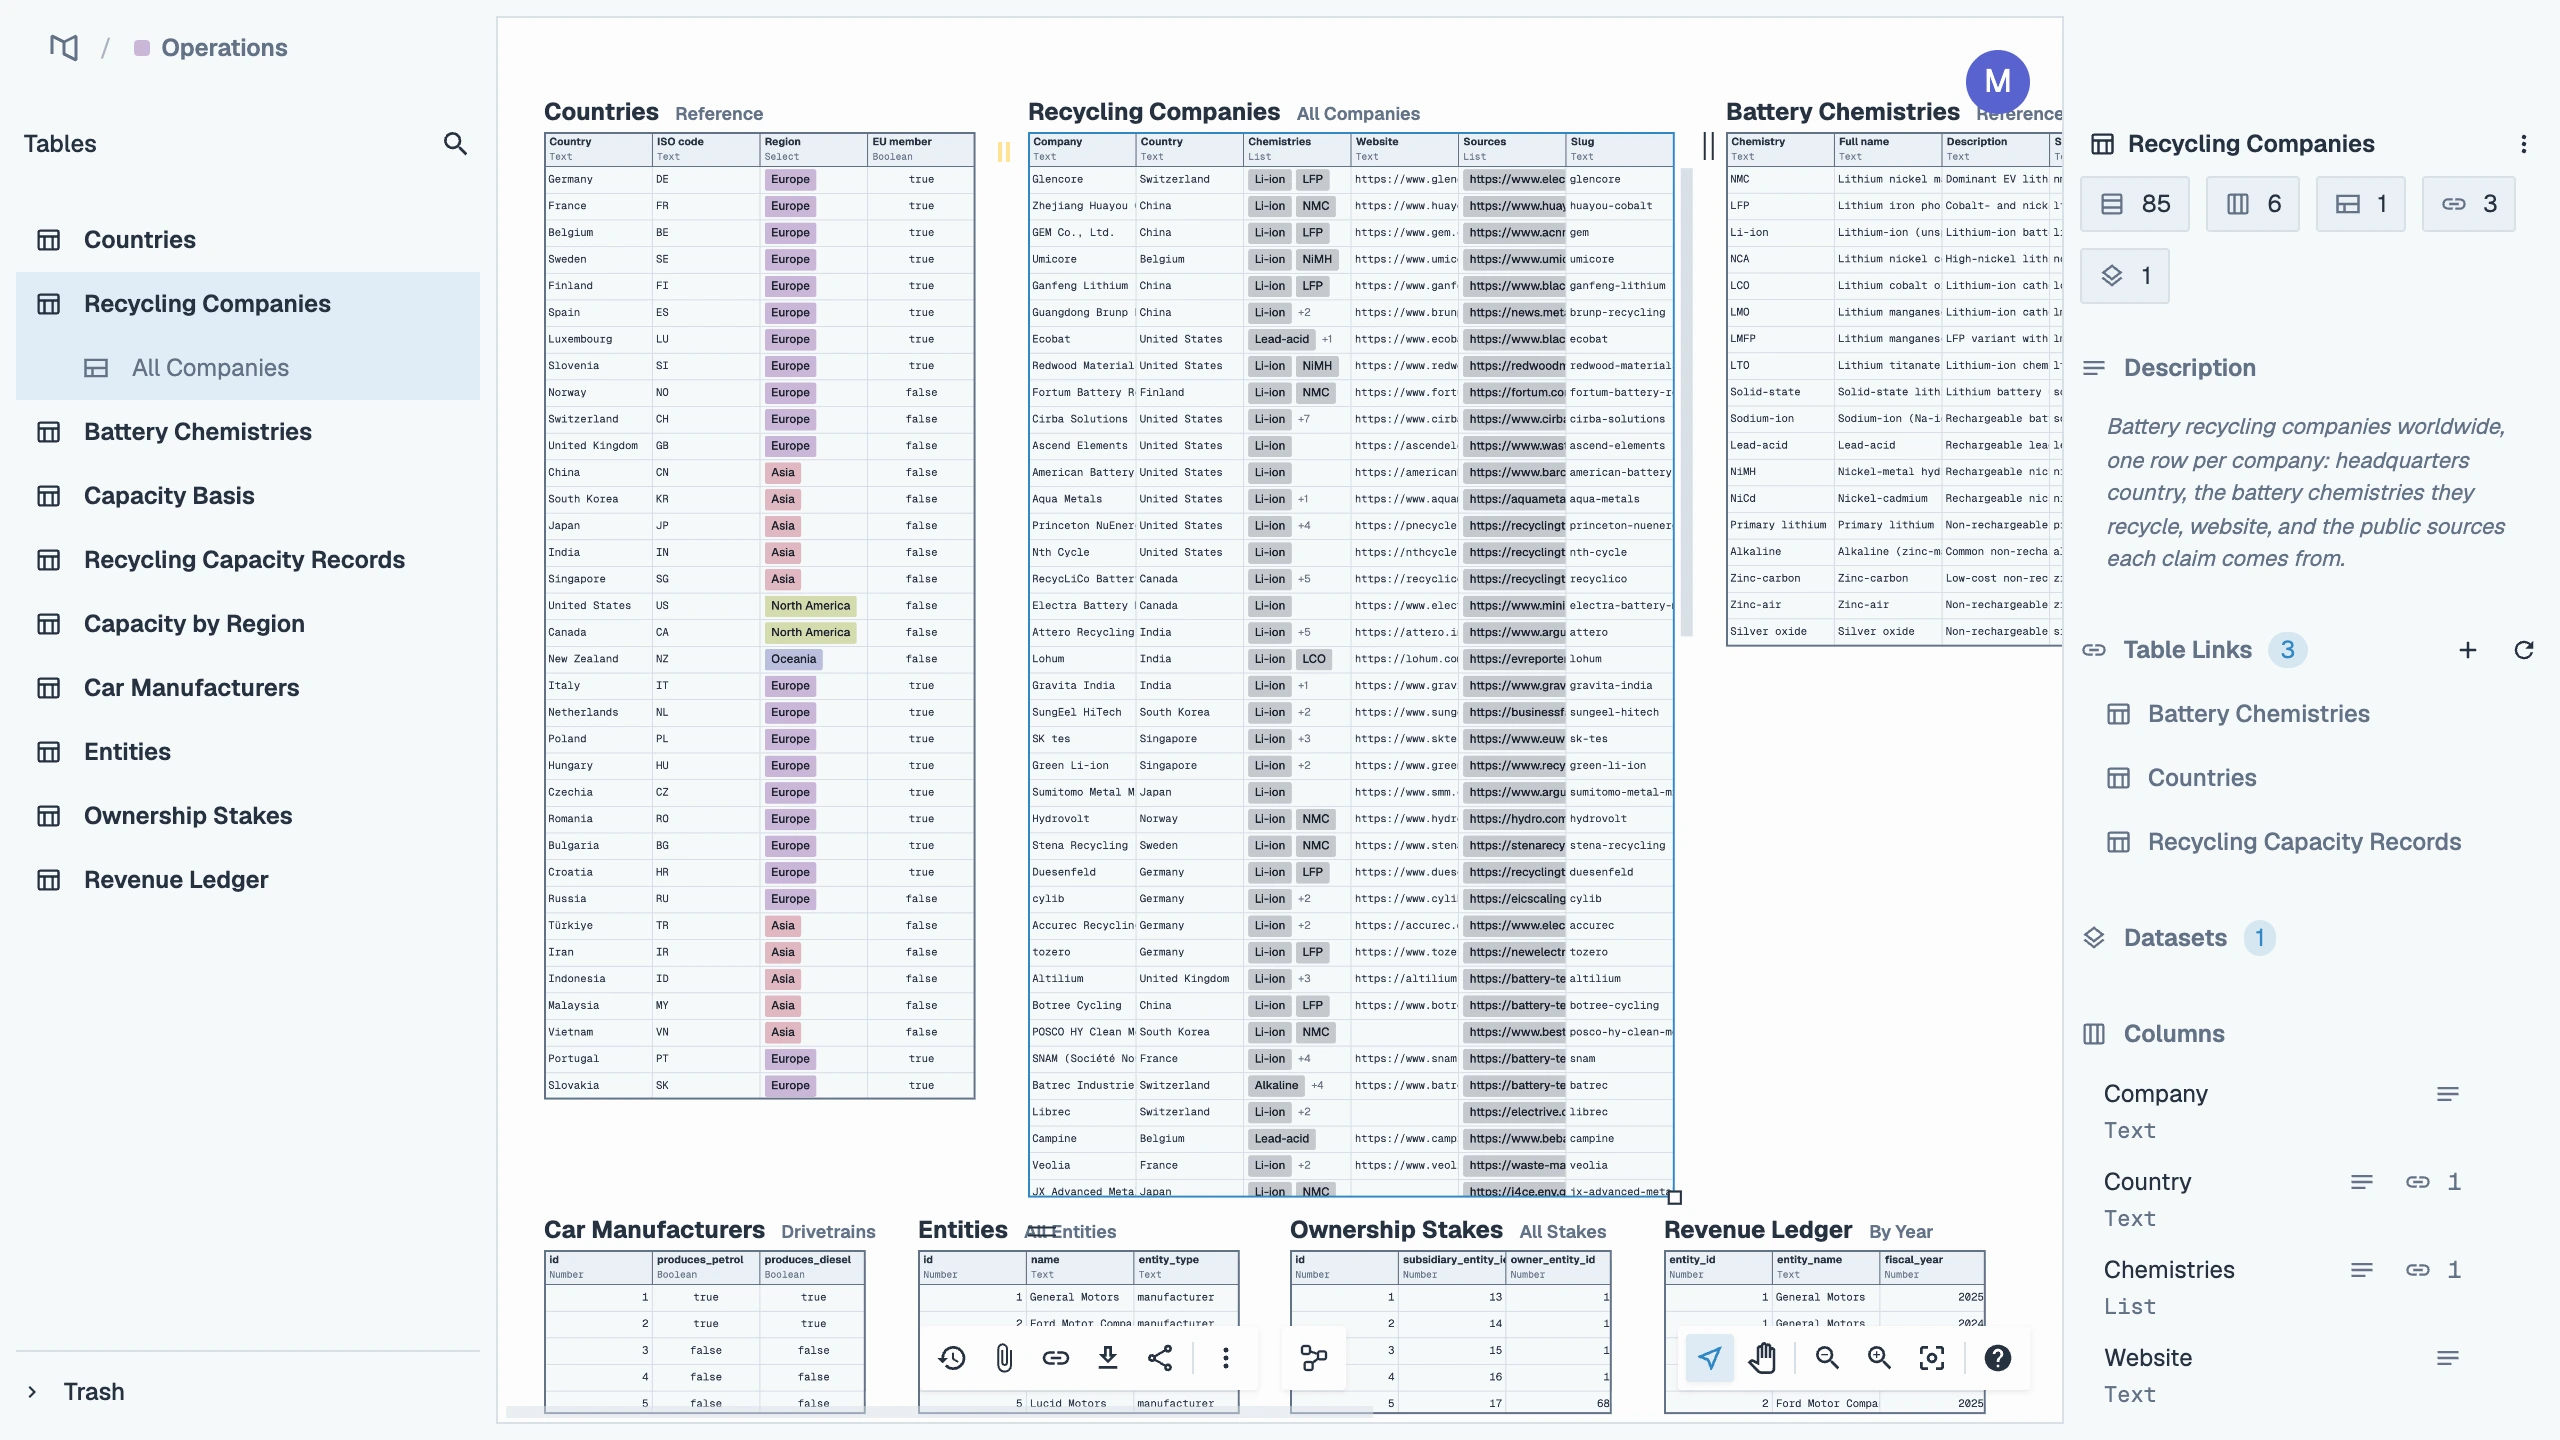
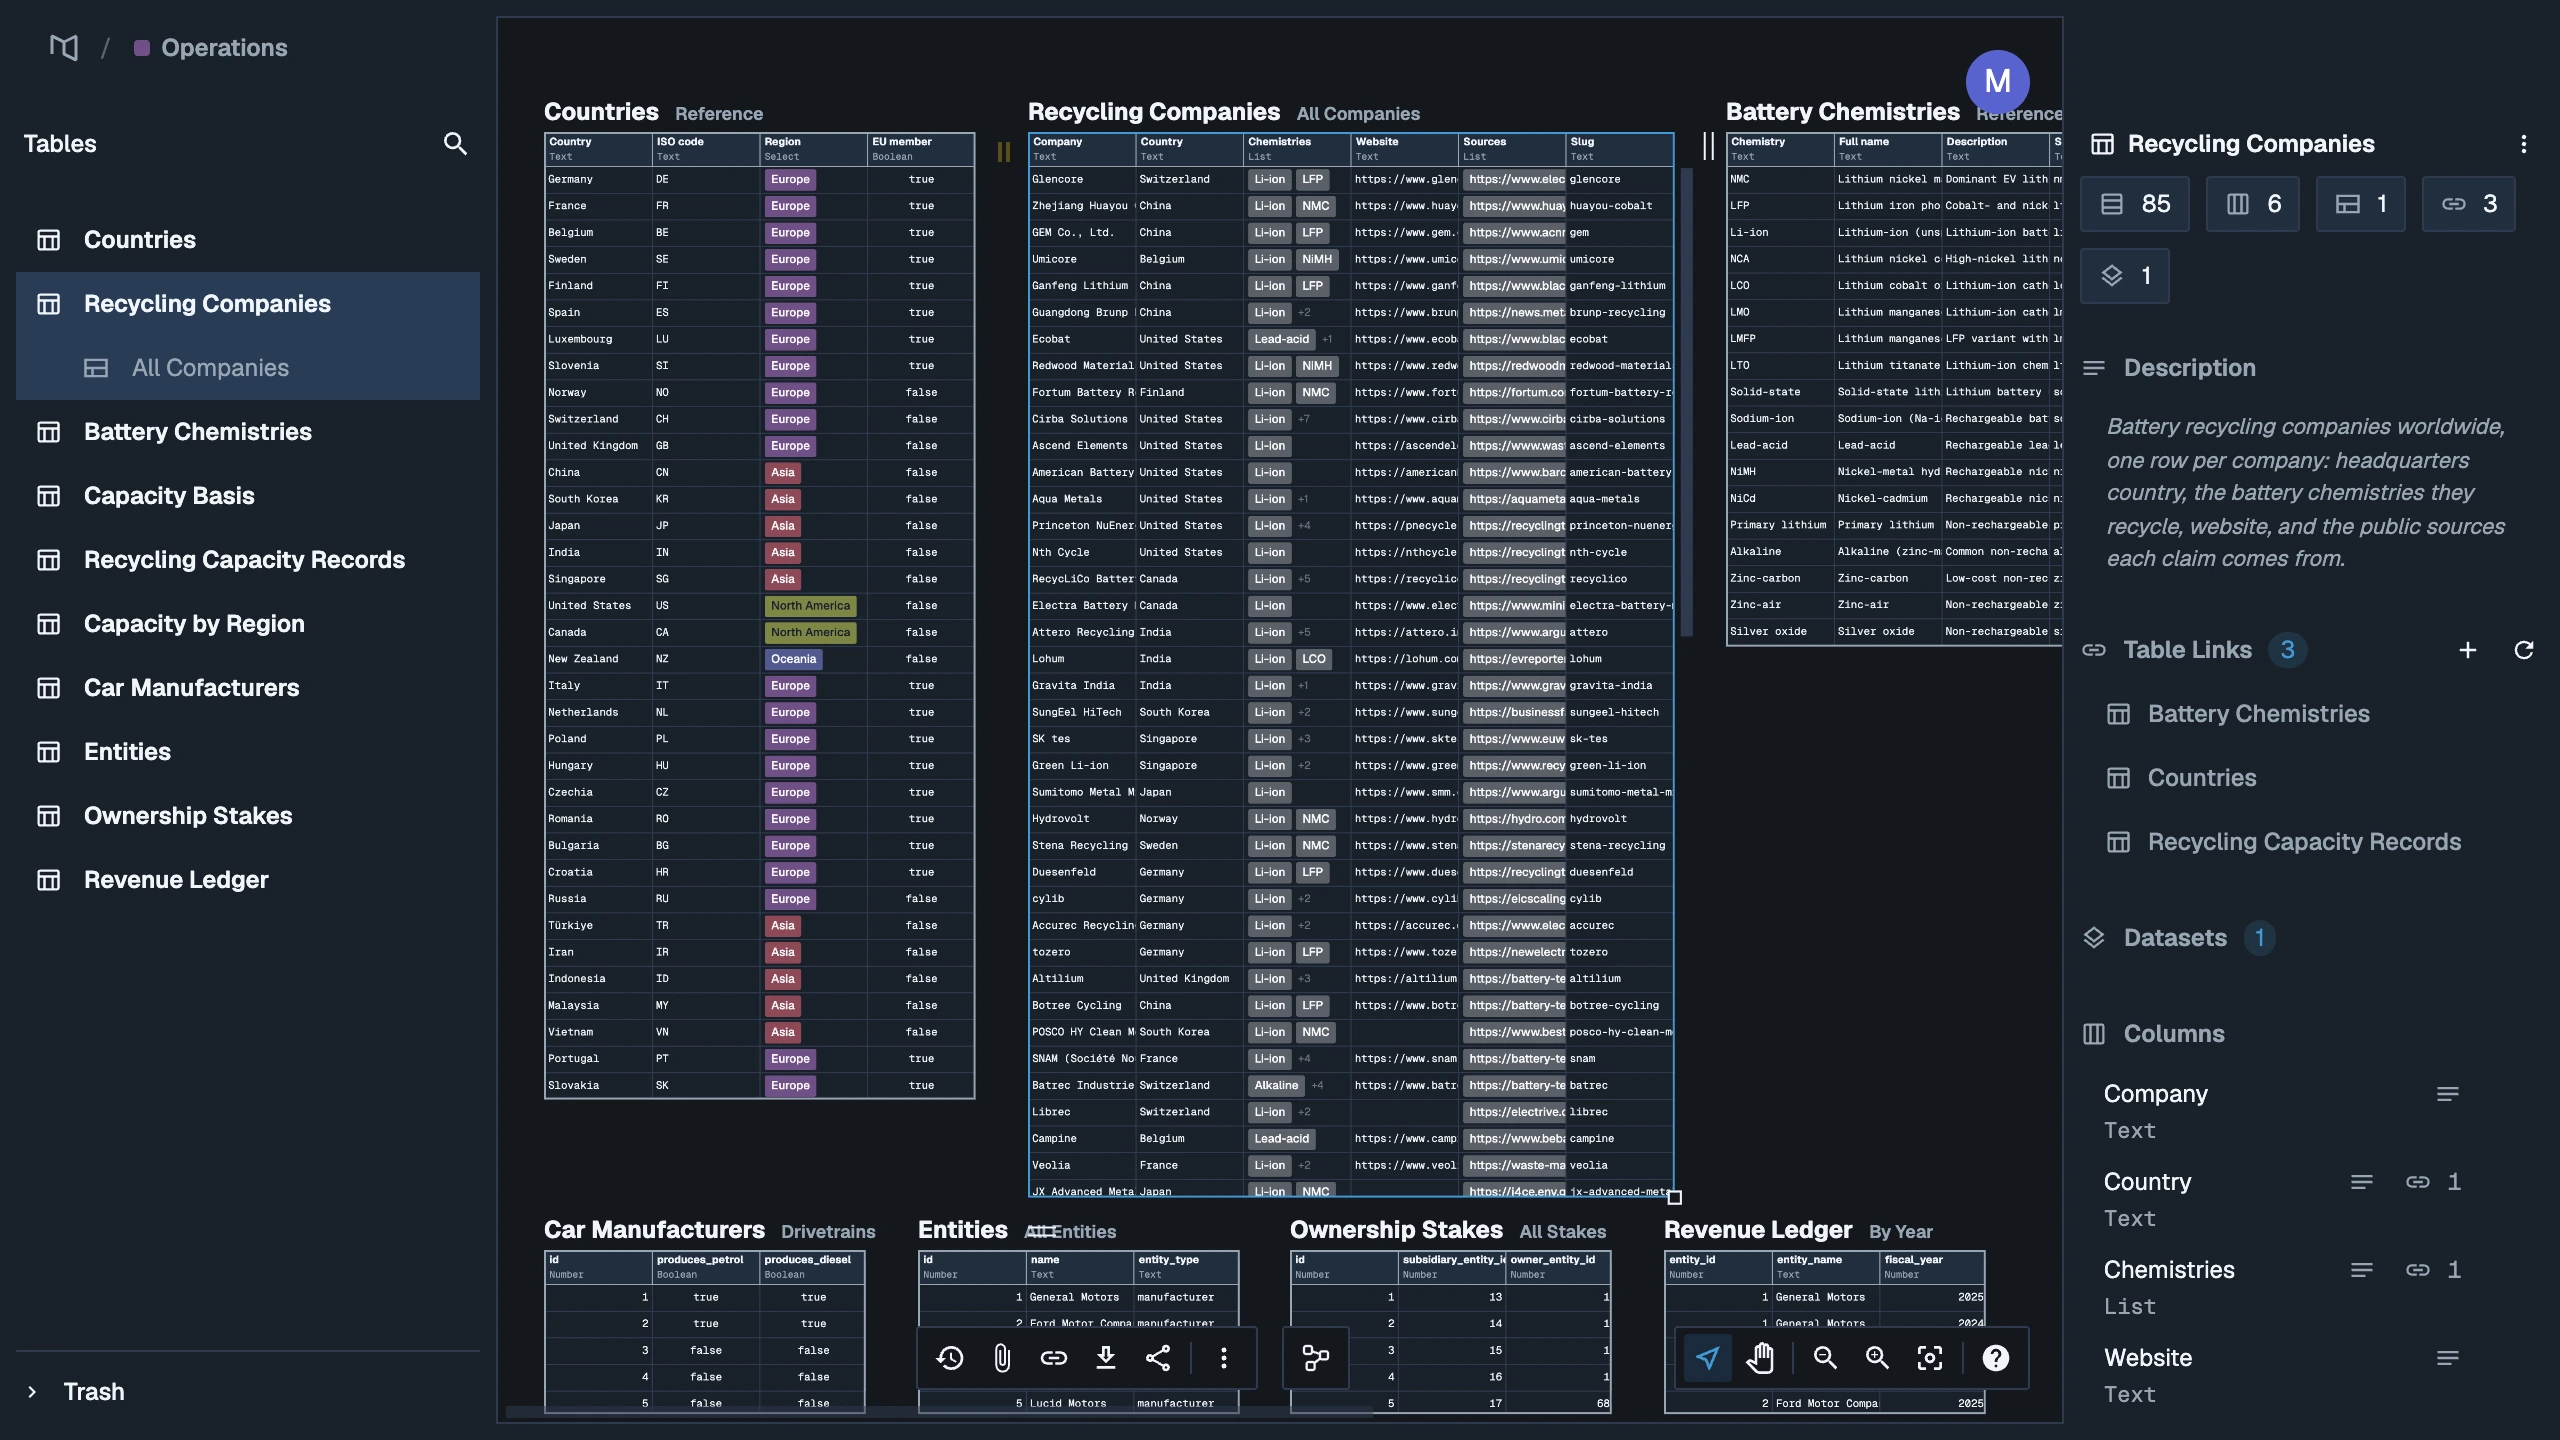
Open a model and its canvas fills the screen. Tables sit on it like sheets on a desk: you can place them anywhere, show several views of one table side by side, and see where your collaborators are working.
 1
2
3
4
5
6
7
8
- Breadcrumb. The Mycorr mark takes you back to the overview; the space name tells you where the model lives.
- Left panel. The Directory lists every table in the model and its views, with the model's trash at the foot; Import brings data in.
- The canvas. Your tables, each drawn through a view. Switch to graph view to see how they link.
- Presence. The avatars of people in the model right now. Their colored squares show what each is selecting; click an avatar to follow them, and press Esc to stop.
- Details pane. What you selected: a table's size, description, links, datasets and columns, or a column's or a row's details.
- Action bar. The actions that fit your selection, such as New Table and Import with nothing selected, or Checkpoints, Add table link and Export on a table. Less frequent actions sit under ⋮.
- Mode bar. Switches between the table canvas and graph view, and runs a row investigation.
- View bar. The select and pan tools, zoom, Fit to Content and Help, with a dot that shows whether your changes are saved.
The canvas covers every bar, graph view and the keyboard shortcuts in detail.
Organization settings
Hover over the organization's name at the top of the sidebar and click the gear. The sections you see depend on your role:
| Section | Holds | Who sees it |
|---|---|---|
| General | Name, image, organization ID, MCP endpoint, and the way out | Everyone |
| Members | The roster, roles and invitations | Owners and admins, outside personal organizations |
| Spaces | Every space and who manages it | Owners and admins |
| Governance | The log of every governance act | Owners and admins, outside personal organizations |
| Plan & usage | The plan, meters and invoices | Owners and admins |
| Model providers | The AI model keys that apps use | Owners and admins |
Account settings
Open your name at the foot of the sidebar and choose Account settings for your profile photo and name, Appearance (light, dark or system), how you get Notifications (by email, in the app, or both), your organizations, and deleting your account. See Your account.
Getting help
- Help on the canvas's view bar opens Canvas basics, a one-minute guided tour, these docs, Contact Support, and Keyboard Shortcuts (press ?).
- Support in the sidebar sends a message to the Mycorr team, or write to support@mycorr.app.