Tables and views
A table holds your data in typed columns and rows, like a table in a database. You see and edit it through views: a table can appear on the canvas several times, each view with its own filter, sort and columns, while the data stays in one place.
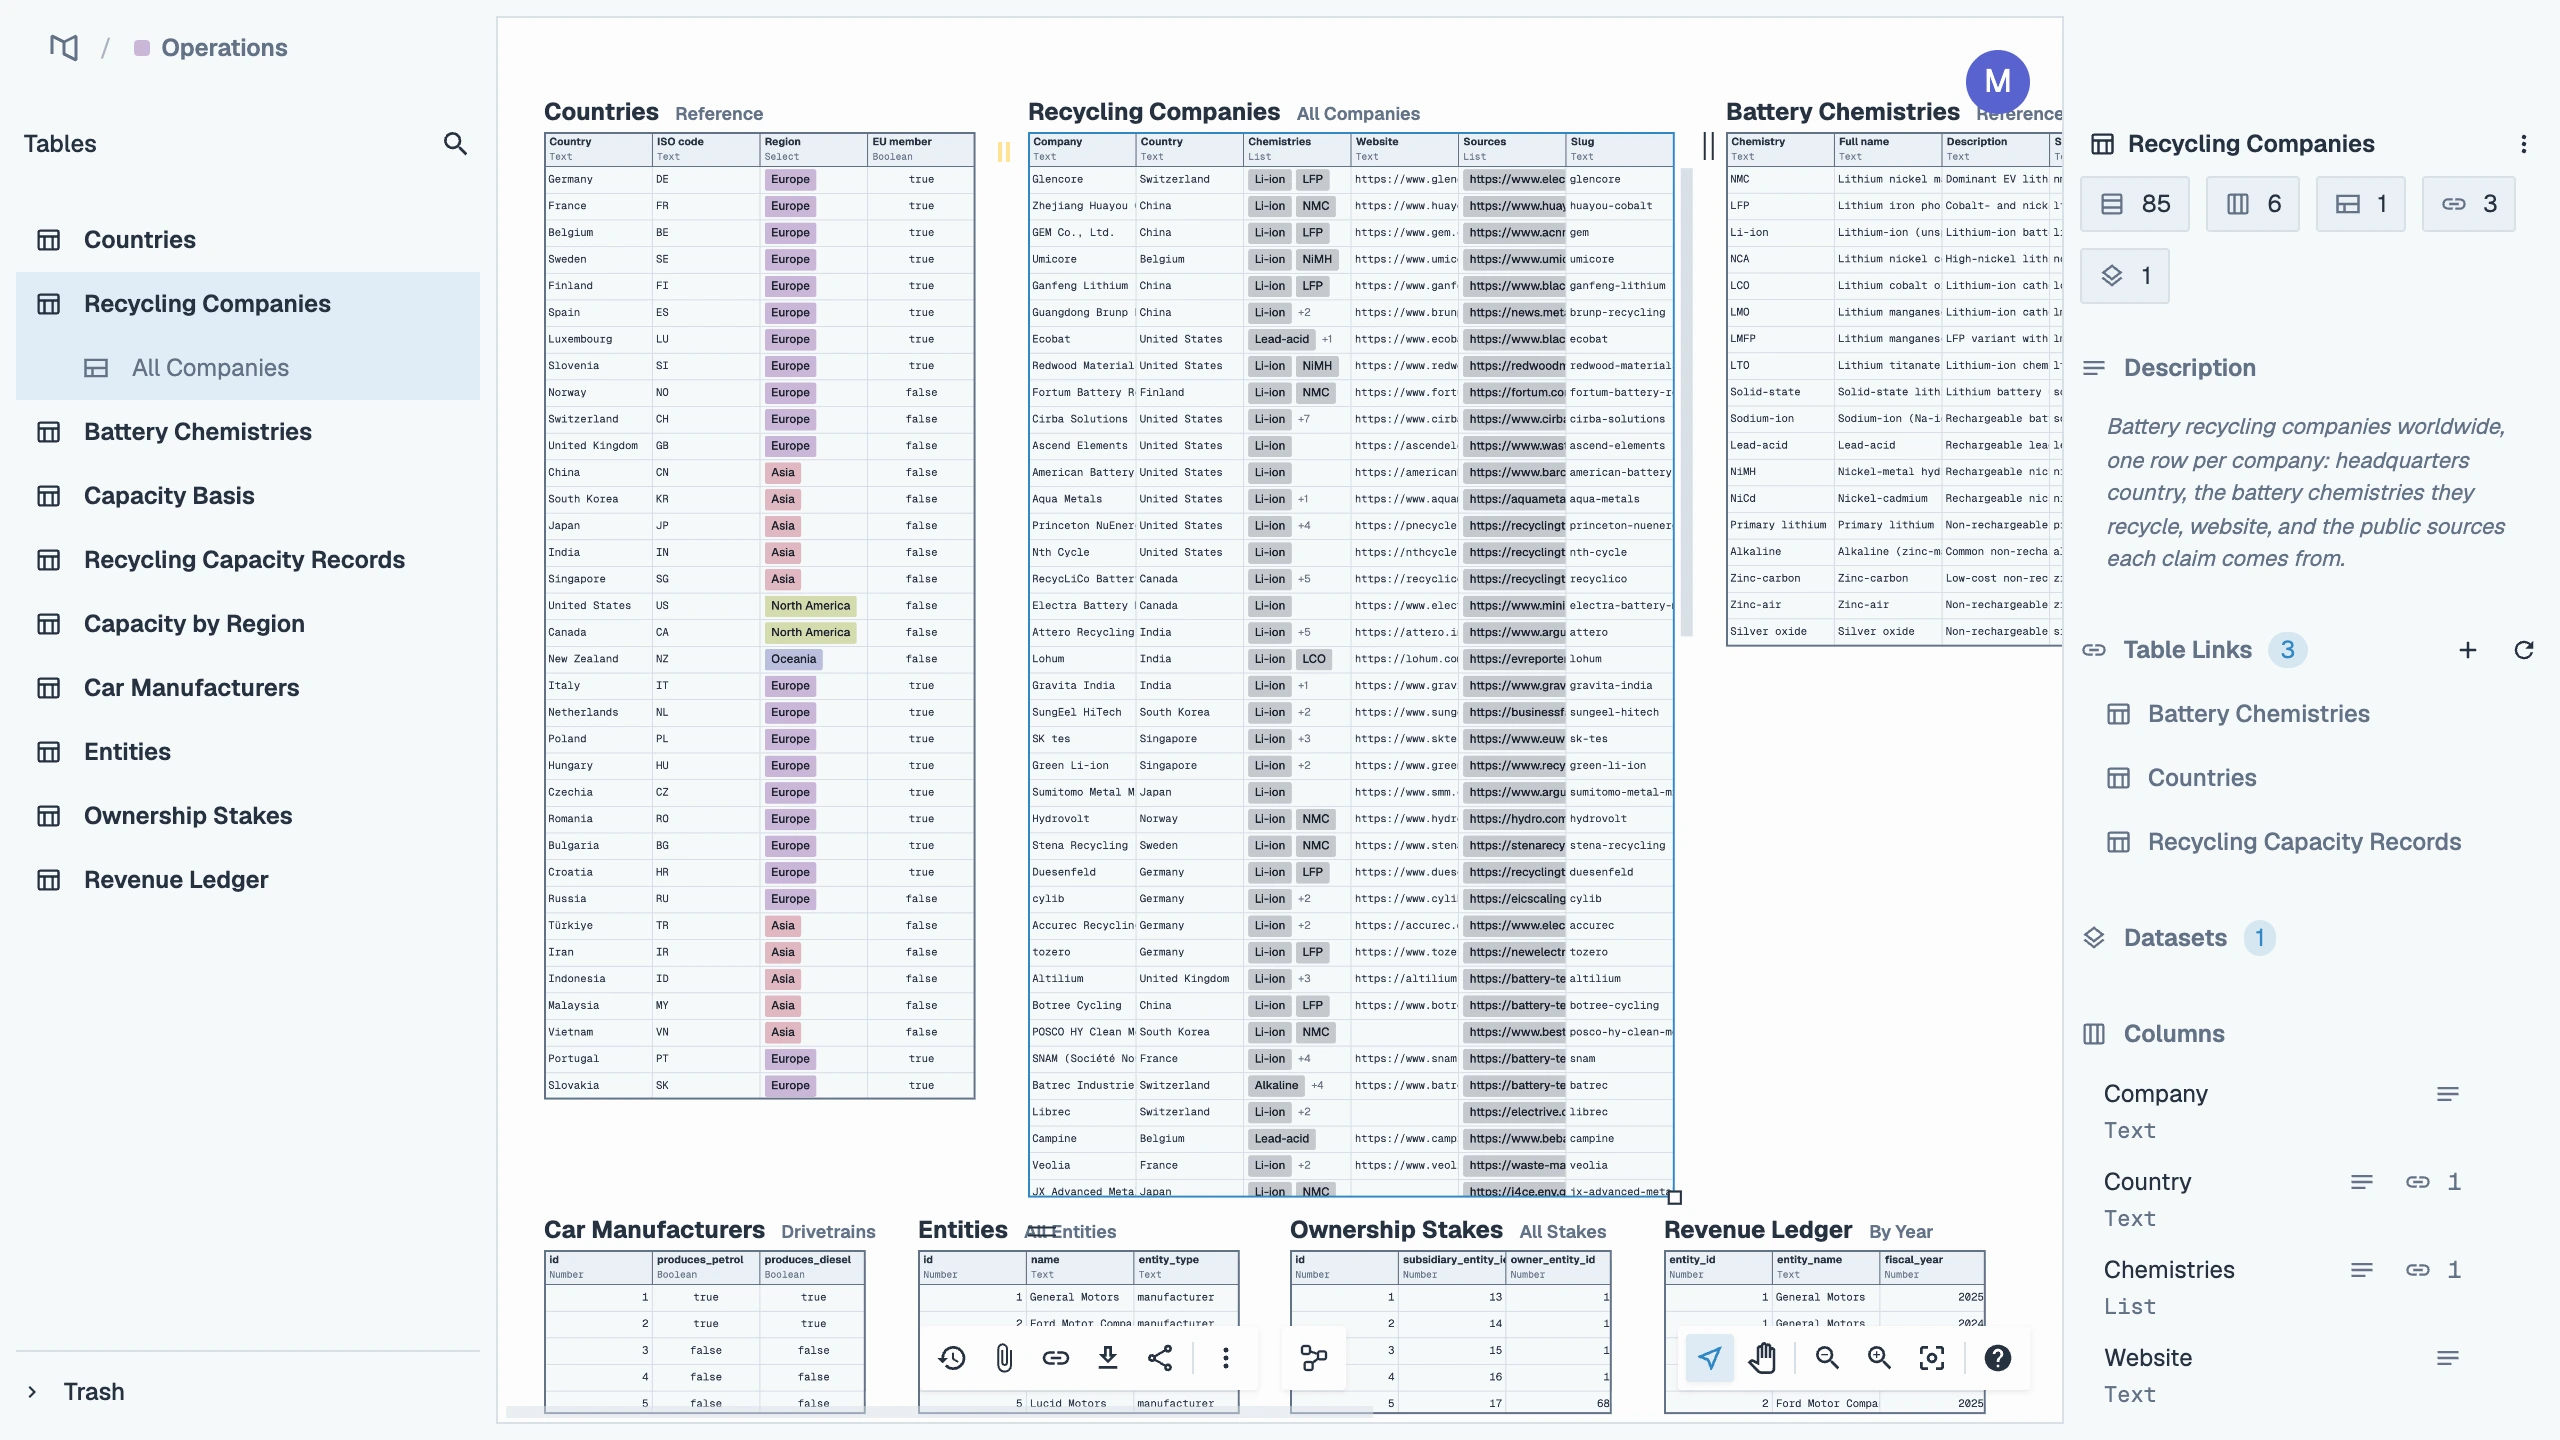
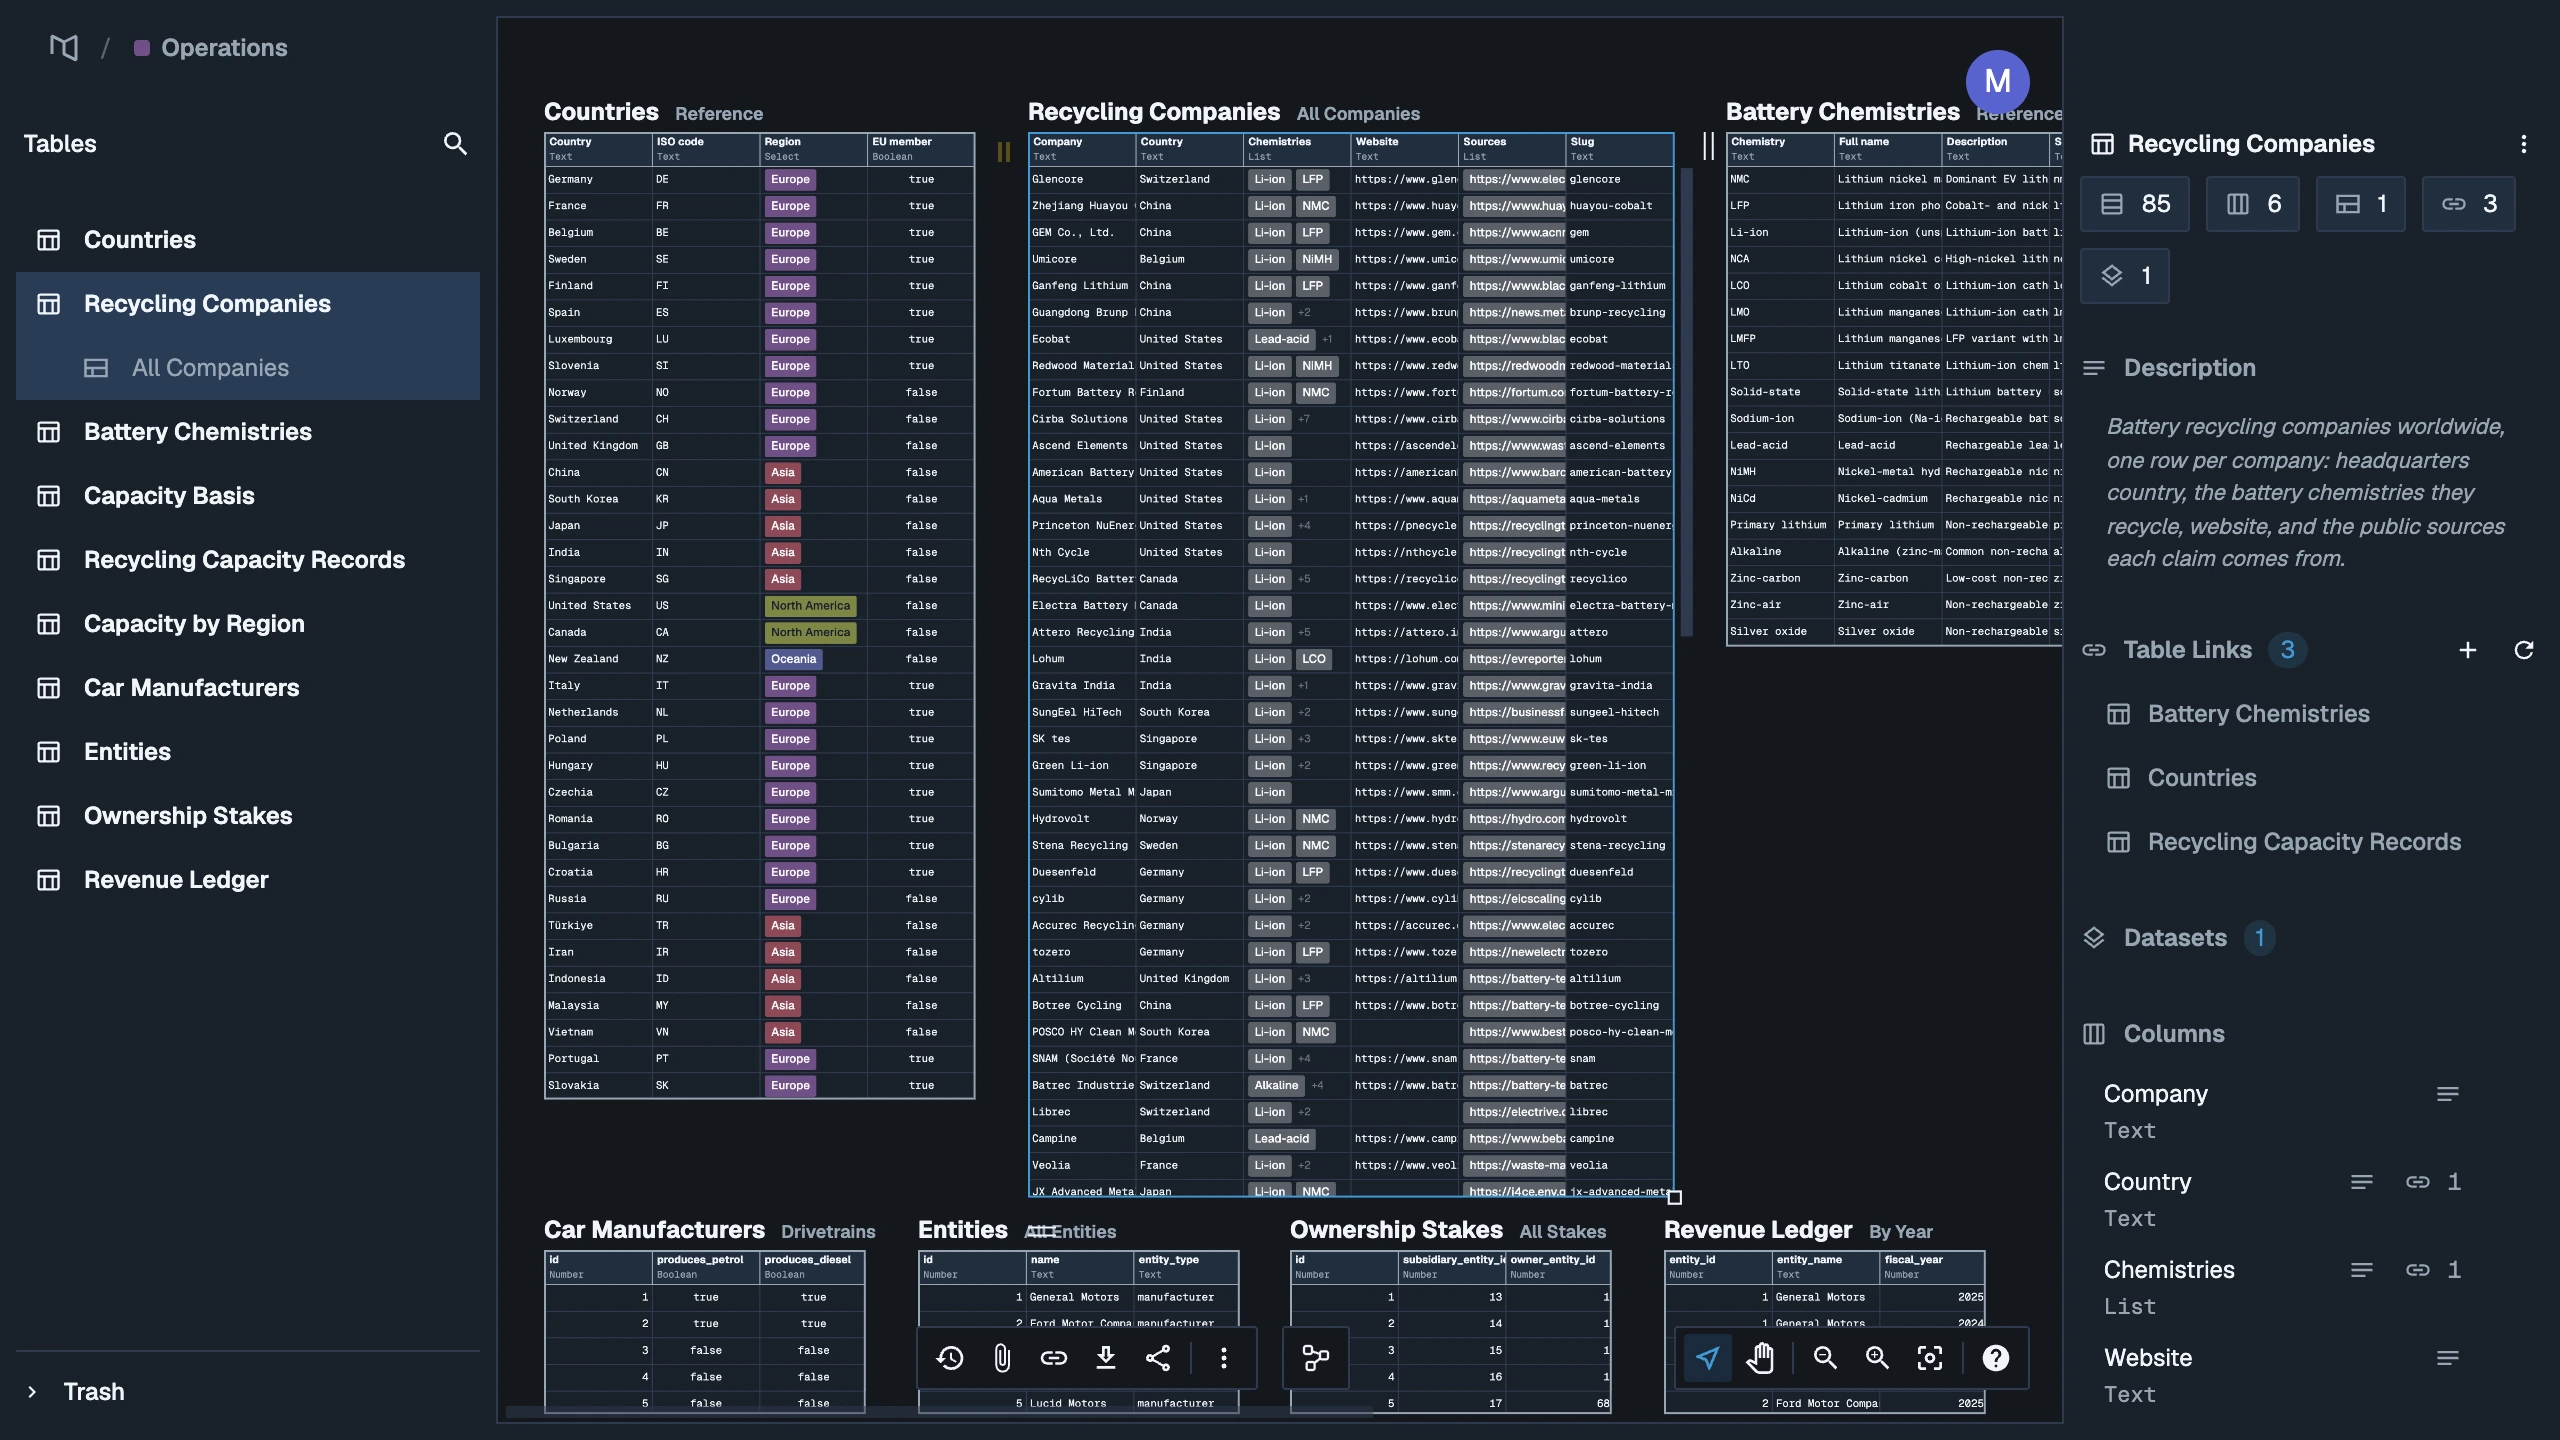
What a table is
Every table has exactly one home model, where it is edited. Inside that model, everyone who can edit the model works on the table's latest data and sees each other's changes as they happen.
A table is made of:
- Columns, each with a name and a type. A column can also carry meaning: a description, a unit, and whether it is a key.
- Rows, which hold the values. Each row has a stable identity, so links, history and AI assistants keep pointing at the right row when it changes.
- Versions. Every change to the data or the columns makes a new version, so you can go back, compare, and decide which version other people read.
The same table can be reused in other models without copying it: they import its released version, read-only.
Kinds of table
Where a table's data comes from decides what you can do with it. The icon beside a table's name in the model's Directory tells you which kind it is.
| Kind | Where the data comes from | Can you edit it here? |
|---|---|---|
| Owned | Created, uploaded or pasted in this model | Yes, if you can edit the model |
| Connected | A connection such as Google Sheets or Postgres | No. Change the source, then sync |
| Imported | Another model's table, at the release you read | No. Its owner edits it in its own model |
| Recipe result | A recipe run; the title carries a Σ and a recipe result chip | No. Run the recipe again to update it |
Views
A view is one appearance of a table on the canvas: a slice of it, filtered, narrowed to some columns, or sorted, while the data stays in the table.
The first view is made with the table; you can add more, and each one keeps its own:
- Position and size on the canvas.
- Columns: which columns it shows, and in what order.
- Filter: which rows it shows.
- Sort: the order of its rows.
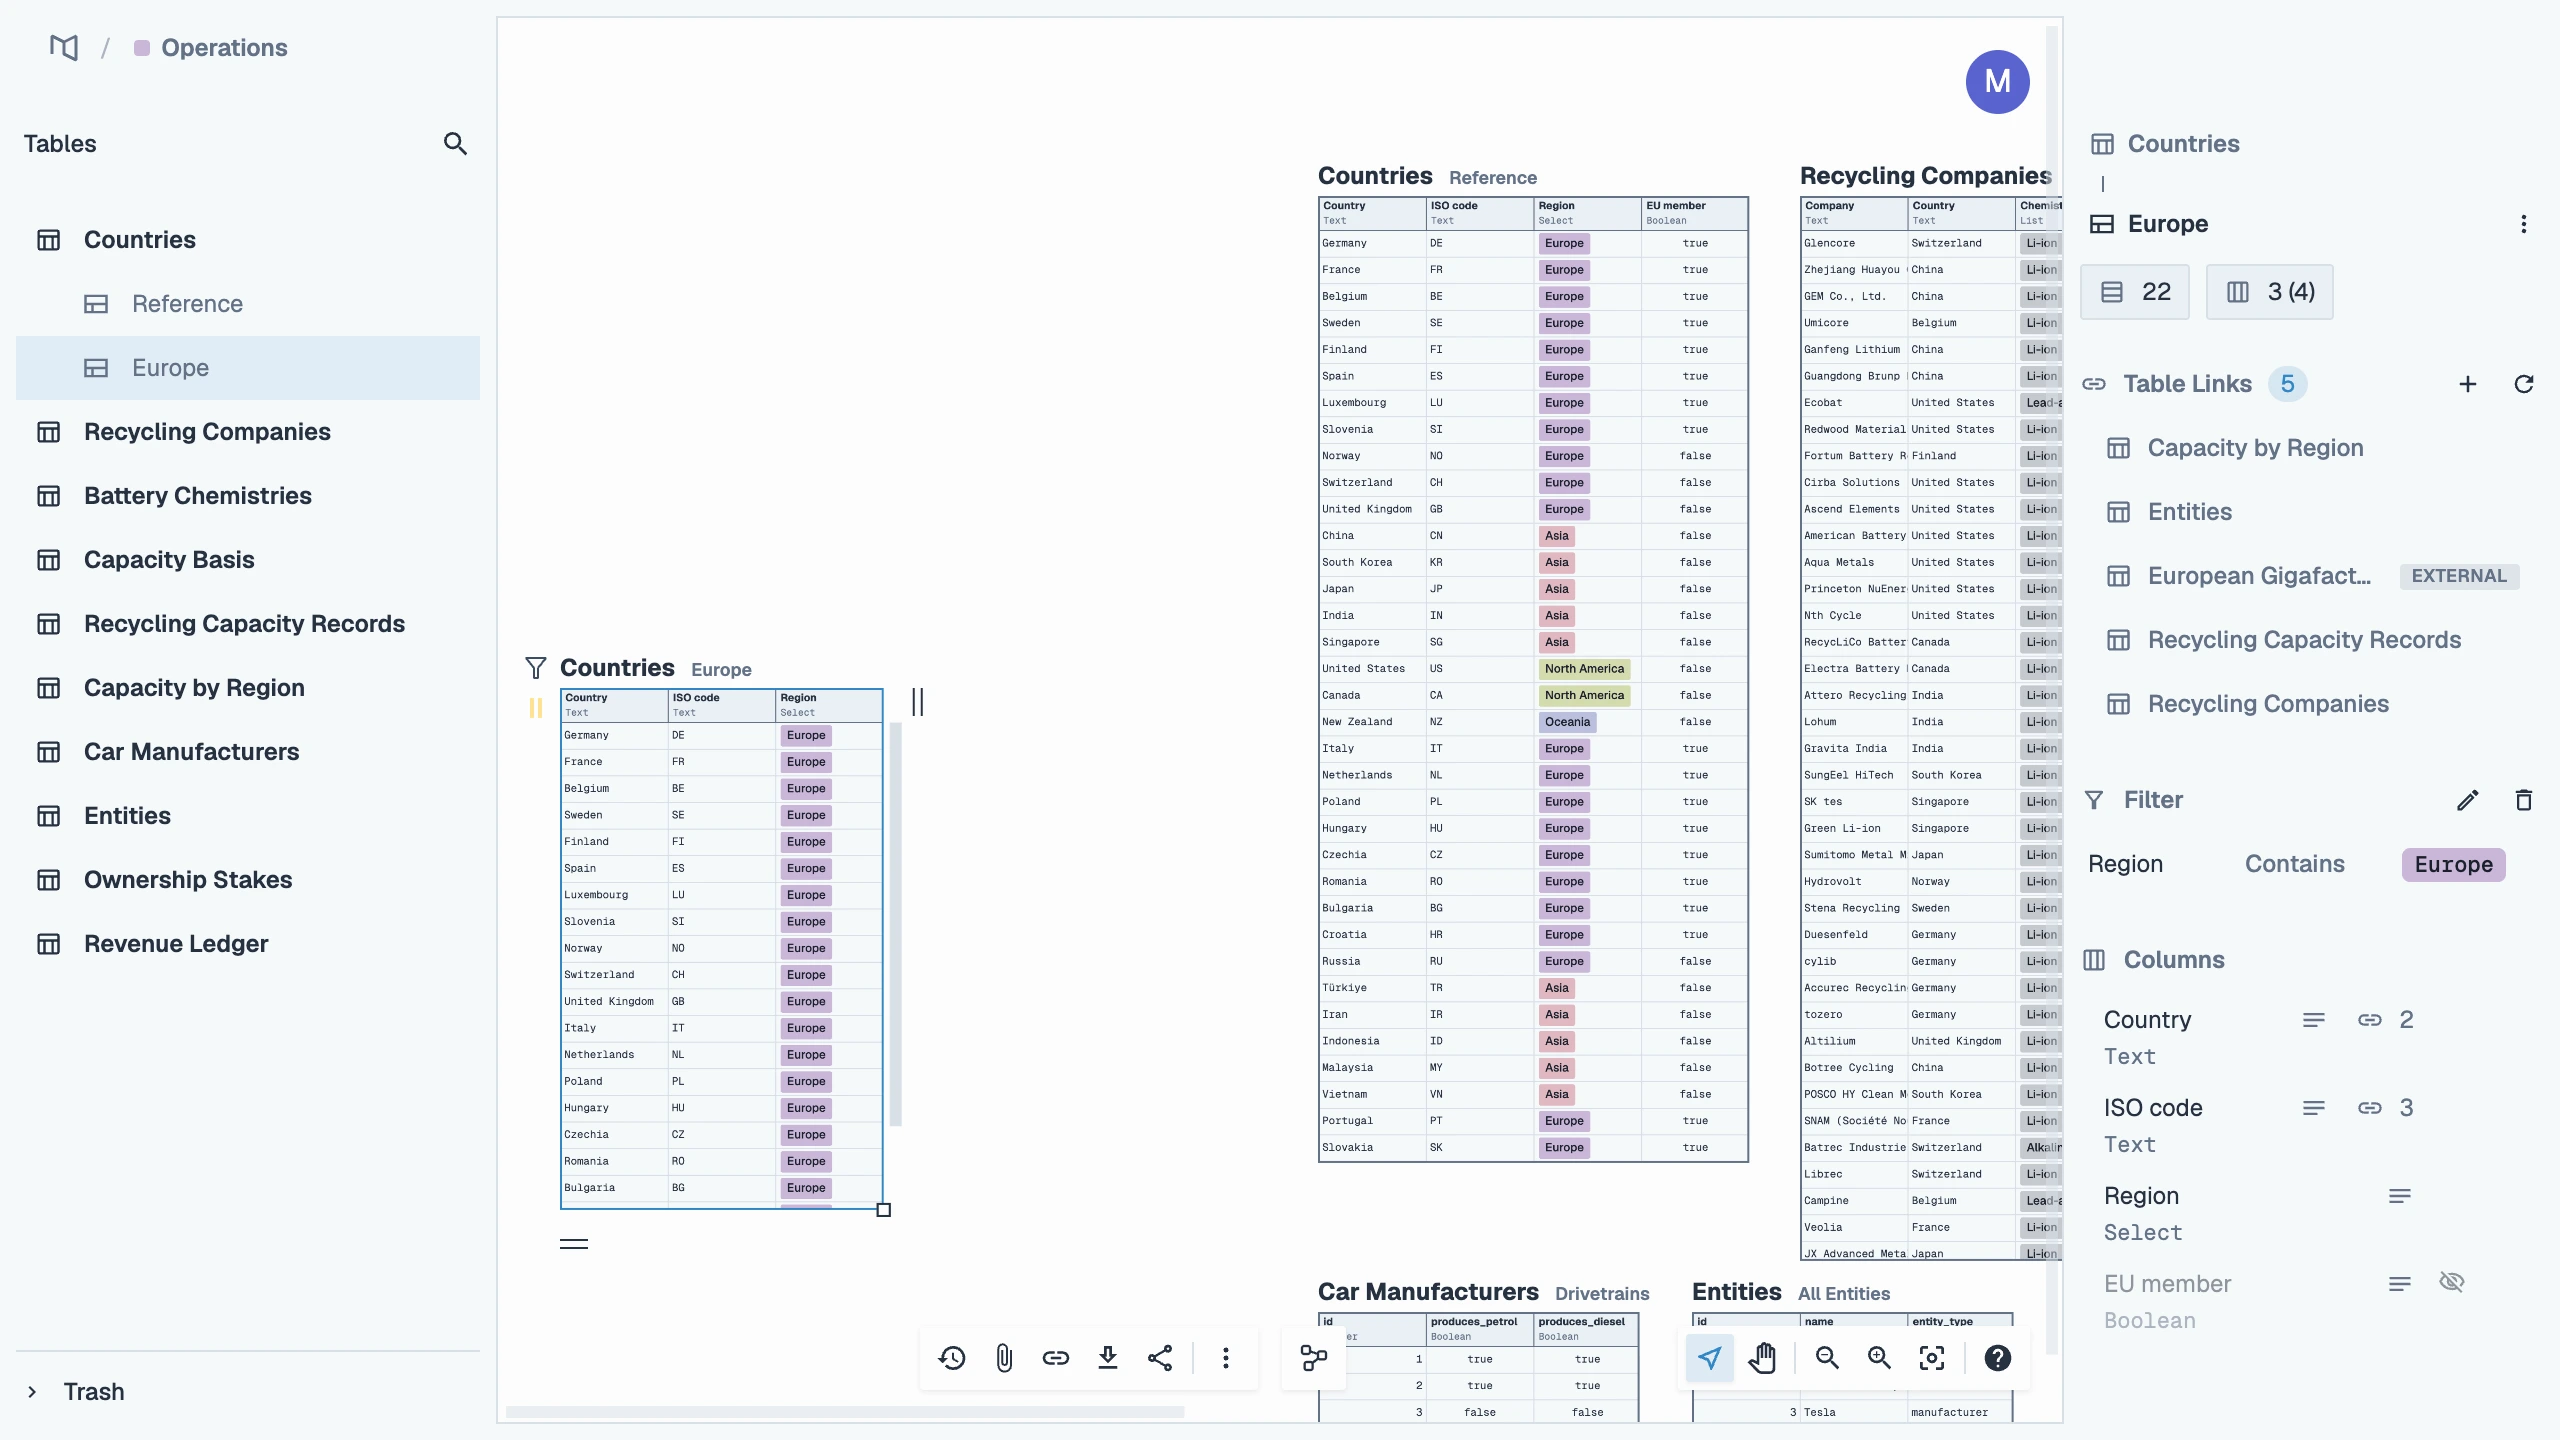
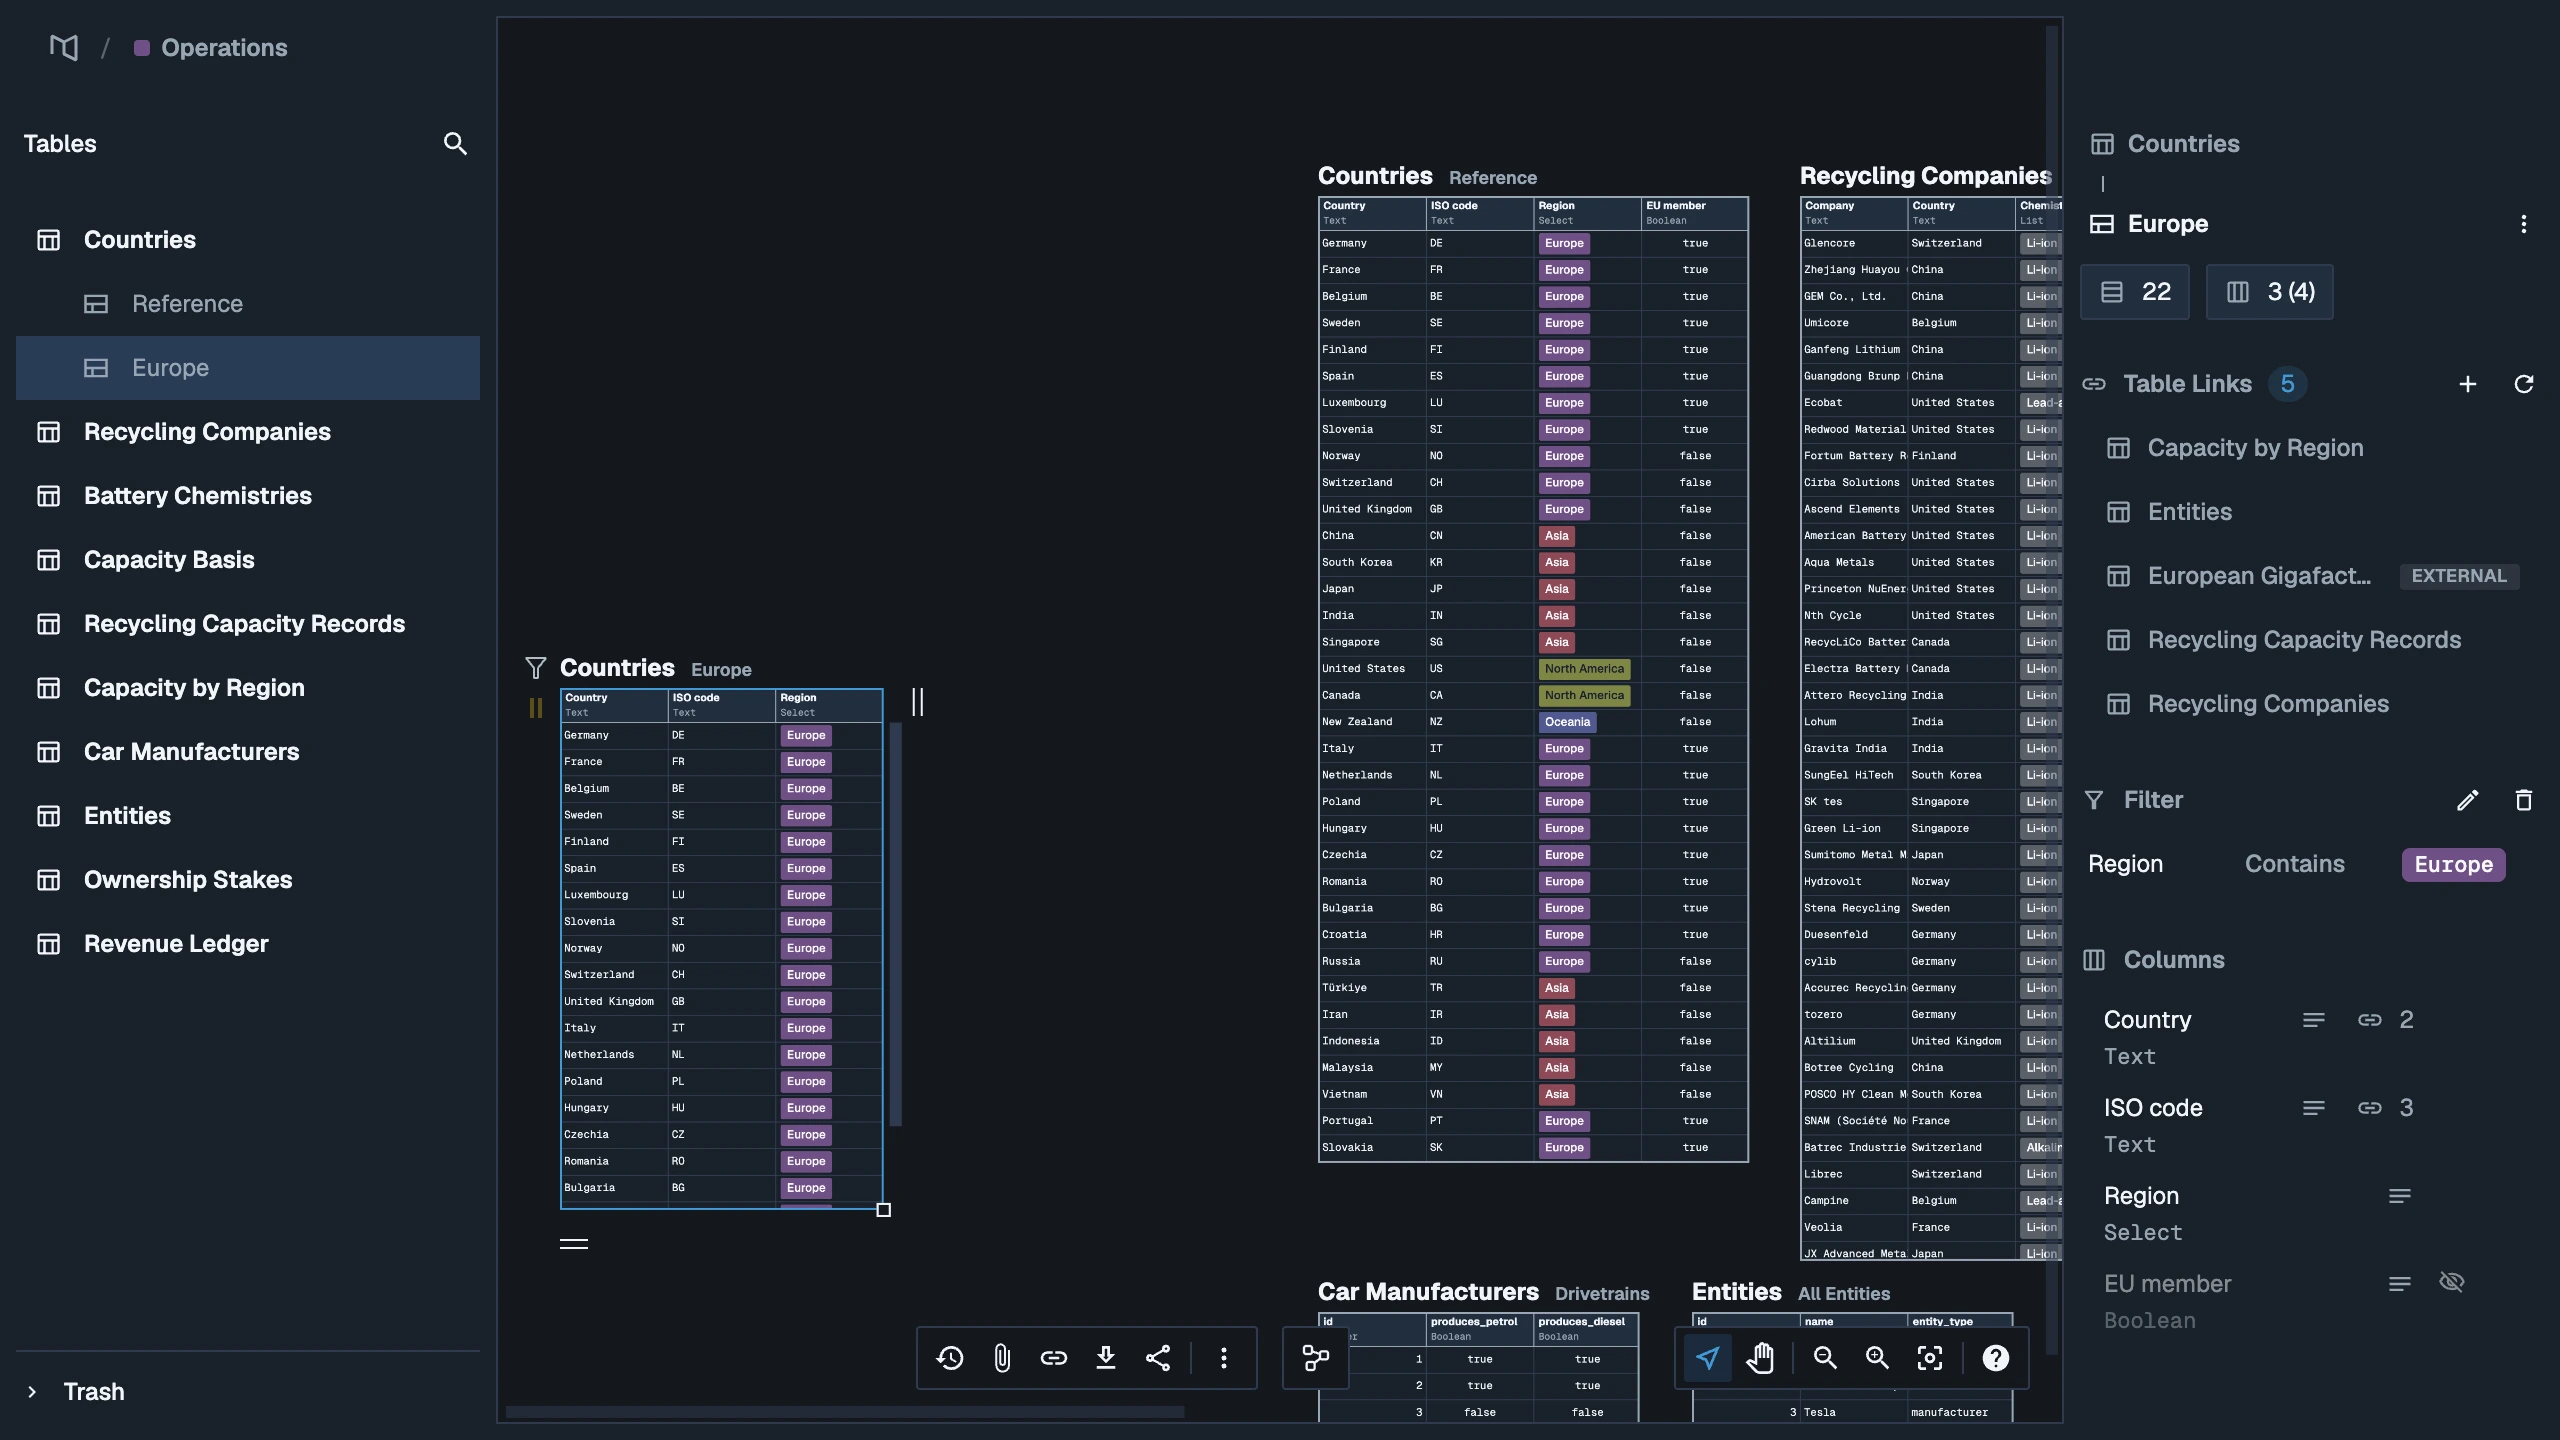
A view never holds data of its own. An edit made in any view lands in the table, and every other view of it shows the change at once.
Views are useful for looking at one table two ways side by side: open orders next to closed ones, or a narrow view with just the columns a colleague needs.
Add a view
- In the Directory panel on the left of the canvas, right-click the table.
- Choose New view.
The new view appears beside the table's other views, and the Directory lists it under the table.
Two shortcuts do the same from the canvas. Select a view, press ⌘ C (Ctrl C on Windows and Linux), point at an empty part of the canvas and press ⌘ V: a copy of the view lands where you pointed. Copy a few column headers instead, and the pasted view shows only those columns.
To remove a view, select it and press ⌫. Removing a view removes only that appearance; the table and its data stay.
Show and hide columns
In the details pane's Columns list, point at a column and click the eye, Hide from view, to take it out of this view only. A hidden column shows a crossed-out eye; click it, Show in view, to bring it back. Hiding a column changes nothing for other views or for the table.
The details pane
Select a table and the pane on the right of the canvas describes it. Its sections appear when they apply:
| Section | What it shows |
|---|---|
| Header | The table's name and its counts: rows, columns, views, links and datasets |
| Description | What the table holds, in words. See Column meaning |
| Columns | Every column with its type, description, unit, intents and links |
| Filter | The view's filter, with Add Filter or Edit Filter |
| Table Links | The tables this one links to. See Links between tables |
| Datasets | The datasets this table belongs to |
| Recipe | For a recipe result, the recipe that made it, with Open recipe |
| Source | For a table from a database, the SQL query it was imported with |
| Import Requests | People asking to import the table, for its owners to accept or decline |
| Checkpoints | The table's history. See Versions and releases |
Select a single row and the pane shows that row's fields instead, with links you can follow to related rows.
Delete and restore a table
Deleting a table moves it to the model's trash. Nothing is lost for 30 days.
- In the Directory panel, right-click the table.
- Choose Delete table. For an imported table the item reads Unimport table: it removes the import from your model and leaves the original untouched.
- If the table belongs to a dataset, the Move to Trash dialog names it. Confirm with Move to Trash.
The model's trash sits at the foot of the Directory panel. From there:
- Restore brings the table back with its data, views and history.
- Delete permanently removes it at once. The dialog lists the datasets it belongs to, because they will show it as deleted.
Deleting a whole model works the same way, one level up: see Trash and recovery.
Related pages
- The canvas: moving around, selecting, and the bars at the bottom.
- Columns and types: what each type holds and how to change it.
- Edits and commits: how changes land, and how to stage them.